2. JVM监控及诊断工具-命令行篇
2.1 概述
性能诊断是软件工程师在日常工作中需要经常面对和解决的问题,在用户体验至上的今天,解决好应用的性能问题能带来非常大的收益。
Java 作为最流行的编程语言之一,其应用性能诊断一直受到业界广泛关注。可能造成 Java 应用出现性能问题的因素非常多,例如线程控制、磁盘读写、数据库访问、网络I/O、垃圾收集等。想要定位这些问题,一款优秀的性能诊断工具必不可少。
体会1:使用数据说明问题,使用知识分析问题,使用工具处理问题。
体会2:无监控、不调优!
2.1.1 简单命令行工具
在我们刚接触java学习的时候,大家肯定最先了解的两个命令就是javac,java,那么除此之外,还有没有其他的命令可以供我们使用呢?
我们进入到安装jdk的bin目录,发现还有一系列辅助工具。这些辅助工具用来获取目标 JVM 不同方面、不同层次的信息,帮助开发人员很好地解决Java应用程序的一些疑难杂症。
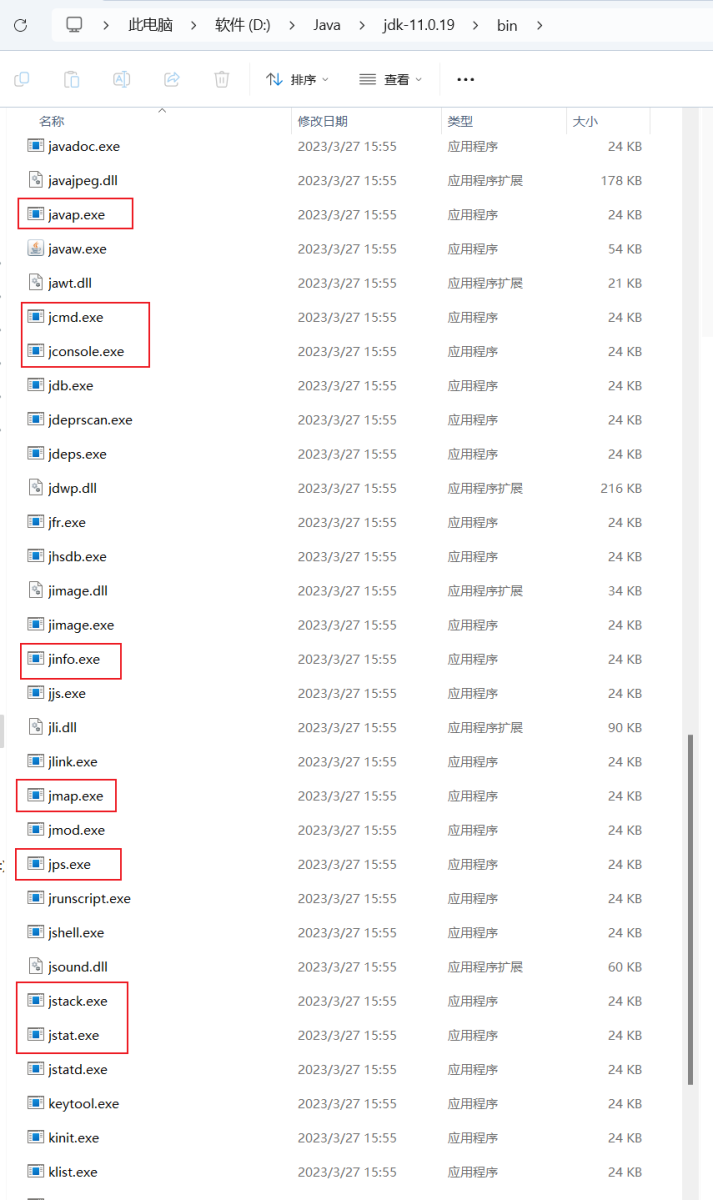
不同版本JDK可能会有所差异,以上为JDK 11 中的工具,JDK 8 中的工具在 JDK 11 中有的已被删除。
官方源码地址:http://hg.openjdk.java.net/jdk/jdk11/file/1ddf9a99e4ad/src/jdk.jcmd/share/classes/sun/tools
2.2 jps 查看正在运行的Java进程
jps(Java Process Status):
显示指定系统内所有的HotSpot虚拟机进程(查看虚拟机进程信息),可用于查询正在运行的虚拟机进程。
说明:对于本地虚拟机进程来说,进程的本地虚拟机ID与操作系统的进程ID是一致的,是唯一的。
C:\Users\Administrator>jps -h
usage: jps [--help]
       jps [-q] [-mlvV] [<hostid>]

Definitions:
    <hostid>:      <hostname>[:<port>]
    -? -h --help -help: Print this help message and exit.
2.2.1 测试
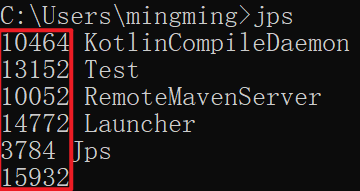
C:\Users\Administrator>jps
27600
32972 Jps

C:\Users\Administrator>jps -l
27600
28536 jdk.jcmd/sun.tools.jps.Jps

C:\Users\Administrator>jps -lv
27600  exit -XX:ErrorFile=C:\Users\Administrator\\java_error_in_webstorm64_%p.log -XX:HeapDumpPath=C:\Users\Administrator\\java_error_in_webstorm64.hprof -Xms128m -Xmx2048m -XX:+HeapDumpOnOutOfMemoryError -XX:-OmitStackTraceInFastThrow -XX:+IgnoreUnrecognizedVMOptions -ea -Dsun.io.useCanonCaches=false -Dsun.java2d.metal=true -Djbr.catch.SIGABRT=true -Djdk.http.auth.tunneling.disabledSchemes="" -Djdk.attach.allowAttachSelf=true -Djdk.module.illegalAccess.silent=true -Dkotlinx.coroutines.debug=off -XX:CICompilerCount=2 -XX:ReservedCodeCacheSize=512m -XX:CompileCommand=exclude,com/intellij/openapi/vfs/impl/FilePartNodeRoot,trieDescend -XX:SoftRefLRUPolicyMSPerMB=50 --add-opens=java.base/jdk.internal.org.objectweb.asm=ALL-UNNAMED --add-opens=java.base/jdk.internal.org.objectweb.asm.tree=ALL-UNNAMED -javaagent:D:/Crack/jetbra/ja-netfilter.jar -Djb.vmOptionsFile=C:\Users\Administrator\AppData\Roaming\\JetBrains\\WebStorm2024.1\webstorm64.exe.vmoptions -Djava.system.class.loader=com.intellij.util.lang.PathClassLoader -Dide
35532 jdk.jcmd/sun.tools.jps.Jps -Denv.class.path=D:\Java\jdk-17.0.8\lib;.; -Dapplication.home=D:\Java\jdk-17.0.8 -Xms8m -Djdk.module.main=jdk.jcmd
2.2.2 基本语法
(1) options 参数
-q:仅仅显示LVMID(local virtual machine id),即本地虚拟机唯一id。不显示主类的名称等-l:输出应用程序主类的全类名 或 如果进程执行的是jar包,则输出jar完整路径-m:输出虚拟机进程启动时传递给主类main()的参数-v:列出虚拟机进程启动时的JVM参数。比如:-Xms20m -Xmx50m是启动程序指定的jvm参数。
说明:以上参数可以综合使用。
补充:如果某 Java 进程关闭了默认开启的UsePerfData参数(即使用参数-XX:-UsePerfData),那么jps命令(以及下面介绍的jstat)将无法探知该Java 进程。
jps -l -m 等价于 jps -lm
(2) hostid 参数
RMI注册表中注册的主机名。如果想要远程监控主机上的 java 程序,需要安装 jstatd。
对于具有更严格的安全实践的网络场所而言,可能使用一个自定义的策略文件来显示对特定的可信主机或网络的访问,尽管这种技术容易受到IP地址欺诈攻击。
如果安全问题无法使用一个定制的策略文件来处理,那么最安全的操作是不运行jstatd服务器,而是在本地使用jstat和jps工具。
2.3 jstat 查看JVM统计信息
jstat(JVM Statistics Monitoring Tool):用于监视虚拟机各种运行状态信息的命令行工具。它可以显示本地或者远程虚拟机进程中的类装载、内存、垃圾收集、JIT编译等运行数据。在没有GUI图形界面,只提供了纯文本控制台环境的服务器上,它将是运行期定位虚拟机性能问题的首选工具。常用于检测垃圾回收问题以及内存泄漏问题。
官方文档:https://docs.oracle.com/javase/8/docs/technotes/tools/unix/jstat.html
2.3.1 基本语法
基本使用语法为:jstat -<option> [-t] [-h<lines>] <vmid> [<interval> [<count>]]
查看命令相关参数:jstat -h 或 jstat -help
C:\Users\Administrator>jstat -h
Usage: jstat --help|-options
       jstat -<option> [-t] [-h<lines>] <vmid> [<interval> [<count>]]

Definitions:
  <option>      An option reported by the -options option
  <vmid>        Virtual Machine Identifier. A vmid takes the following form:
                     <lvmid>[@<hostname>[:<port>]]
                Where <lvmid> is the local vm identifier for the target
                Java virtual machine, typically a process id; <hostname> is
                the name of the host running the target Java virtual machine;
                and <port> is the port number for the rmiregistry on the
                target host. See the jvmstat documentation for a more complete
                description of the Virtual Machine Identifier.
  <lines>       Number of samples between header lines.
  <interval>    Sampling interval. The following forms are allowed:
                    <n>["ms"|"s"]
                Where <n> is an integer and the suffix specifies the units as
                milliseconds("ms") or seconds("s"). The default units are "ms".
  <count>       Number of samples to take before terminating.
  -J<flag>      Pass <flag> directly to the runtime system.
  -? -h --help  Prints this help message.
  -help         Prints this help message.
其中<vmid>是进程id号,也就是jps之后看到的前面的号�码,如下:
(1) options 参数
选项option可以由以下值构成。
类装载相关的:
-class:显示ClassLoader的相关信息:类的装载、卸载数量、总空间、类装载所消耗的时间等
C:\Users\Administrator>jstat -class 37464
Loaded   Bytes  Unloaded  Bytes     Time
  6969 13231.4         0    0.0      0.84
垃圾回收相关的:
-gc:显示与GC相关的堆信息。包括Eden区、两个Survivor区、老年代、永久代等的容量、已用空间、GC时间合计等信息。-gccapacity:显示内容与-gc基本相同,但输出主要关注Java堆各个区域使用到的最大、最小空间。-gcutil:显示内容与-gc基本相同,但输出主要关注已使用空间占总空间的百分比。-gccause:与-gcutil功能一样,但是会额外输出导致最后一次或当前正在发生的GC产生的原因。-gcnew:显示新生代GC状况-gcnewcapacity:显示内容与-gcnew基本相同,输出主要关注使用到的最大、最小空间-geold:显示老年代GC状况-gcoldcapacity:显示内容与-gcold基本相同,输出主要关注使用到的最大、最小空间-gcpermcapacity:显示永久代使用到的最大、最小空间。
C:\Users\Administrator>jstat -gc 37464
    S0C         S1C         S0U         S1U          EC           EU           OC           OU          MC         MU       CCSC      CCSU     YGC     YGCT     FGC    FGCT     CGC    CGCT       GCT
    0.0      8192.0         0.0      5046.9      16384.0          0.0      57344.0       9276.5    27840.0    27353.7    3968.0    3751.7      4     0.022     0     0.000     2     0.001     0.023
- 新生代相关
- S0C是第一个幸存者区的大小(字节)
- S1C是第二个幸存者区的大小(字节)
- S0U是第一个幸存者区已使用的大小(字节)
- S1U是第二个幸存者区已使用的大小(字节)
- EC是Eden空间的大小(字节)
- EU是Eden空间已使用大小(字节)
- 老年代相关
- OC是老年代的大小(字节)
- OU是老年代已使用的大小(字节)
- 方法区(元空间)相关
- MC是方法区的大小
- MU是方法区已使用的大小
- CCSC是压缩类空间的大小
- CCSU是压缩类空间已使用的大小
- 其他
- YGC是从应用程序启动到采样时young gc的次数
- YGCT是指从应用程序启动到采样时young gc消耗时间(秒)
- FGC是从应用程序启动到采样时full gc的次数
- FGCT是从应用程序启动到采样时的full gc的消耗时间(秒)
- GCT是从应用程序启动到采样时gc的总时间
JIT相关的:
-compiler:显示JIT编译器编译过的方法、耗时等信息-printcompilation:输出已经被JIT编译的方法
C:\Users\Administrator>jstat -compiler 37464
Compiled Failed Invalid   Time   FailedType FailedMethod
    3555      1       0     0.52          1 java/util/HashMap putVal

C:\Users\Administrator>jstat -printcompilation 37464
Compiled  Size  Type Method
    3555     38    1 sun/nio/ch/SelectorImpl keys
(2) interval参数
用于指定输出统计数据的周期,单位为毫秒。即:查询间隔
(3) count参数
用于指定查询的总次数
(4) -t参数
可以在输出信息前加上一个Timestamp列,显示程序的运行时间。单位:秒
经验
我们可以比较 Java 进程的启动时间以及总 GC 时间 (GCT 列),或量词测量的间隔时间以及总 GC 时间的增量,来得出 GC 时间占运行时间的比例。
如果该比例超过 20%,则说明目前堆的压力较大;如果比例超过 90%,则说明堆里几乎没有可用空间,随时都可能抛出 OOM 异常。
我们执行jstat -gc -t 13152 1000 10,这代表1秒打印出1行,一共10行,-t代表打印出Timestamp总运行时间,结果如下所示:

上方红色框框中代表Timestamp,而蓝色框框中代表垃圾回收时间,单位都是秒,如果让红色框框中的某两个值相减,假设这个值是,然后让对应行的蓝色框框中的另外两个值相减,假设这个值是,之后让 ,得出的差值就是上述所说的GC时间占运行时间的比例
虽然这种方式比较�繁琐,但是在项目部署之后就需要使用命令行去看了,就没有可视化界面了,所以这种方式也要会
(5) -h参数
可以在周期性数据输出时,输出多少行数据后输出一个表头信息
2.3.2 补充
jstat还可以用来判断是否出现内存泄漏。
- 第1步:
在长时间运行的 Java 程序中,我们可以运行jstat命令连续获取多行性能数据,并取这几行数据中 OU 列(即已占用的老年代内存)的最小值。 - 第2步:
然后,我们每隔一段较长的时间重复一次上述操作,来获得多组 OU 最小值。如果这些值呈上涨趋势,则说明该 Java 程序的老年代内存已使用量在不断上涨,这意味着无法回收的对象在不断增加,因此很有可能存在内存泄漏。
2.4 jinfo 实时查看和修改JVM配置参数
jinfo (Configuration Info for Java)
查看虚拟机配置参数信息,也可用于调整虚拟机的配置参数。
在很多情况卡,Java应用程序不会指定所有的Java虚拟机参数。而此时,开发人员可能不知道某一个具体的Java虚拟机参数的默认值。在这种情况下,可能需要通过查找文档获取某个参数的默认值。这个查找过程可能是非常艰难的。但有了jinfo工具,开发人员可以很方便地找到Java虚拟机参数的当前值。
C:\Users\Administrator>jinfo
Usage:
    jinfo <option> <pid>
       (to connect to a running process)

where <option> is one of:
    -flag <name>         to print the value of the named VM flag
    -flag [+|-]<name>    to enable or disable the named VM flag
    -flag <name>=<value> to set the named VM flag to the given value
    -flags               to print VM flags
    -sysprops            to print Java system properties
    <no option>          to print both VM flags and system properties
    -? | -h | --help | -help to print this help message
官方帮助文档:https://docs.oracle.com/en/java/javase/11/tools/jinfo.html
2.4.1 基本用法
2.4.1.1 查看
(1) jinfo -sysprops <pid>
可以查看由System.getProperties()取得的参数
C:\Users\Administrator>jinfo -sysprops 37464
Java System Properties:
#Wed May 22 22:58:04 CST 2024
java.specification.version=17
sun.cpu.isalist=amd64
sun.jnu.encoding=GBK
java.class.path=H\:\\IdeaProjects\\spring-webmvc-demo\\target\\classes;G\:\\Maven\\repo\\org\\springframework\\boot\\spring-boot-starter-web\\3.2.3\\spring-boot-starter-web-3.2.3.jar;G\:\\Maven\\repo\\org\\springframework\\boot\\spring-boot-starter\\3.2.3\\spring-boot-starter-3.2.3.jar;G\:\\Maven\\repo\\org\\springframework\\boot\\spring-boot\\3.2.3\\spring-boot-3.2.3.jar;G\:\\Maven\\repo\\org\\springframework\\boot\\spring-boot-autoconfigure\\3.2.3\\spring-boot-autoconfigure-3.2.3.jar;G\:\\Maven\\repo\\org\\springframework\\boot\\spring-boot-starter-logging\\3.2.3\\spring-boot-starter-logging-3.2.3.jar;G\:\\Maven\\repo\\ch\\qos\\logback\\logback-classic\\1.4.14\\logback-classic-1.4.14.jar;G\:\\Maven\\repo\\ch\\qos\\logback\\logback-core\\1.4.14\\logback-core-1.4.14.jar;G\:\\Maven\\repo\\org\\apache\\logging\\log4j\\log4j-to-slf4j\\2.21.1\\log4j-to-slf4j-2.21.1.jar;G\:\\Maven\\repo\\org\\apache\\logging\\log4j\\log4j-api\\2.21.1\\log4j-api-2.21.1.jar;G\:\\Maven\\repo\\org\\slf4j\\jul-to-slf4j\\2.0.12\\jul-to-slf4j-2.0.12.jar;G\:\\Maven\\repo\\jakarta\\annotation\\jakarta.annotation-api\\2.1.1\\jakarta.annotation-api-2.1.1.jar;G\:\\Maven\\repo\\org\\yaml\\snakeyaml\\2.2\\snakeyaml-2.2.jar;G\:\\Maven\\repo\\org\\springframework\\boot\\spring-boot-starter-json\\3.2.3\\spring-boot-starter-json-3.2.3.jar;G\:\\Maven\\repo\\com\\fasterxml\\jackson\\core\\jackson-databind\\2.15.4\\jackson-databind-2.15.4.jar;G\:\\Maven\\repo\\com\\fasterxml\\jackson\\core\\jackson-annotations\\2.15.4\\jackson-annotations-2.15.4.jar;G\:\\Maven\\repo\\com\\fasterxml\\jackson\\core\\jackson-core\\2.15.4\\jackson-core-2.15.4.jar;G\:\\Maven\\repo\\com\\fasterxml\\jackson\\datatype\\jackson-datatype-jdk8\\2.15.4\\jackson-datatype-jdk8-2.15.4.jar;G\:\\Maven\\repo\\com\\fasterxml\\jackson\\datatype\\jackson-datatype-jsr310\\2.15.4\\jackson-datatype-jsr310-2.15.4.jar;G\:\\Maven\\repo\\com\\fasterxml\\jackson\\module\\jackson-module-parameter-names\\2.15.4\\jackson-module-parameter-names-2.15.4.jar;G\:\\Maven\\repo\\org\\springframework\\boot\\spring-boot-starter-tomcat\\3.2.3\\spring-boot-starter-tomcat-3.2.3.jar;G\:\\Maven\\repo\\org\\apache\\tomcat\\embed\\tomcat-embed-core\\10.1.19\\tomcat-embed-core-10.1.19.jar;G\:\\Maven\\repo\\org\\apache\\tomcat\\embed\\tomcat-embed-el\\10.1.19\\tomcat-embed-el-10.1.19.jar;G\:\\Maven\\repo\\org\\apache\\tomcat\\embed\\tomcat-embed-websocket\\10.1.19\\tomcat-embed-websocket-10.1.19.jar;G\:\\Maven\\repo\\org\\springframework\\spring-web\\6.1.4\\spring-web-6.1.4.jar;G\:\\Maven\\repo\\org\\springframework\\spring-beans\\6.1.4\\spring-beans-6.1.4.jar;G\:\\Maven\\repo\\io\\micrometer\\micrometer-observation\\1.12.3\\micrometer-observation-1.12.3.jar;G\:\\Maven\\repo\\io\\micrometer\\micrometer-commons\\1.12.3\\micrometer-commons-1.12.3.jar;G\:\\Maven\\repo\\org\\springframework\\spring-webmvc\\6.1.4\\spring-webmvc-6.1.4.jar;G\:\\Maven\\repo\\org\\springframework\\spring-aop\\6.1.4\\spring-aop-6.1.4.jar;G\:\\Maven\\repo\\org\\springframework\\spring-context\\6.1.4\\spring-context-6.1.4.jar;G\:\\Maven\\repo\\org\\springframework\\spring-expression\\6.1.4\\spring-expression-6.1.4.jar;G\:\\Maven\\repo\\org\\springframework\\boot\\spring-boot-configuration-processor\\3.2.3\\spring-boot-configuration-processor-3.2.3.jar;G\:\\Maven\\repo\\org\\projectlombok\\lombok\\1.18.30\\lombok-1.18.30.jar;G\:\\Maven\\repo\\org\\slf4j\\slf4j-api\\2.0.12\\slf4j-api-2.0.12.jar;G\:\\Maven\\repo\\org\\springframework\\spring-core\\6.1.4\\spring-core-6.1.4.jar;G\:\\Maven\\repo\\org\\springframework\\spring-jcl\\6.1.4\\spring-jcl-6.1.4.jar
java.vm.vendor=Oracle Corporation
sun.arch.data.model=64
user.variant=
catalina.useNaming=false
java.vendor.url=https\://java.oracle.com/
user.timezone=Asia/Shanghai
os.name=Windows 11
java.vm.specification.version=17
sun.java.launcher=SUN_STANDARD
user.country=CN
sun.boot.library.path=D\:\\Java\\jdk-17.0.8\\bin
sun.java.command=org.depsea.springwebmvcdemo.SpringWebmvcDemoApplication
spring.application.admin.enabled=true
com.sun.management.jmxremote=
jdk.debug=release
spring.liveBeansView.mbeanDomain=
sun.cpu.endian=little
user.home=C\:\\Users\\Administrator
user.language=zh
java.specification.vendor=Oracle Corporation
java.version.date=2023-07-18
java.home=D\:\\Java\\jdk-17.0.8
spring.output.ansi.enabled=always
file.separator=\\
java.vm.compressedOopsMode=Zero based
line.separator=\r\n
java.vm.specification.vendor=Oracle Corporation
java.specification.name=Java Platform API Specification
FILE_LOG_CHARSET=UTF-8
java.awt.headless=true
user.script=
sun.management.compiler=HotSpot 64-Bit Tiered Compilers
java.runtime.version=17.0.8+9-LTS-211
user.name=Administrator
spring.jmx.enabled=true
path.separator=;
management.endpoints.jmx.exposure.include=*
os.version=10.0
java.runtime.name=Java(TM) SE Runtime Environment
file.encoding=UTF-8
java.vm.name=Java HotSpot(TM) 64-Bit Server VM
java.vendor.url.bug=https\://bugreport.java.com/bugreport/
java.io.tmpdir=C\:\\Users\\Administrator\\AppData\\Local\\Temp\\
catalina.home=C\:\\Users\\Administrator\\AppData\\Local\\Temp\\tomcat.8080.12439771490002140328
java.version=17.0.8
user.dir=H\:\\IdeaProjects\\spring-webmvc-demo
os.arch=amd64
java.vm.specification.name=Java Virtual Machine Specification
PID=37464
sun.os.patch.level=
CONSOLE_LOG_CHARSET=UTF-8
catalina.base=C\:\\Users\\Administrator\\AppData\\Local\\Temp\\tomcat.8080.12439771490002140328
native.encoding=GBK
java.library.path=D\:\\Java\\jdk-17.0.8\\bin;C\:\\Windows\\Sun\\Java\\bin;C\:\\Windows\\system32;C\:\\Windows;C\:\\Program Files (x86)\\Common Files\\Intel\\Shared Libraries\\redist\\intel64\\compiler;D\:\\Program Files (x86)\\VMware\\VMware Workstation\\bin\\;C\:\\Windows\\system32;C\:\\Windows;C\:\\Windows\\System32\\Wbem;C\:\\Windows\\System32\\WindowsPowerShell\\v1.0\\;C\:\\Windows\\System32\\OpenSSH\\;C\:\\Program Files\\Wolfram Research\\WolframScript\\;D\:\\Program Files (x86)\\NetSarang\\Xshell 7\\;D\:\\Program Files (x86)\\NetSarang\\Xftp 7\\;D\:\\Program Files (x86)\\NetSarang\\Xmanager 7\\;D\:\\Program Files (x86)\\NetSarang\\Xlpd 7\\;D\:\\Java\\jdk-17.0.8\\bin;C\:\\Program Files\\Docker\\Docker\\resources\\bin;D\:\\ProgramData\\anaconda3;D\:\\ProgramData\\anaconda3\\Scripts;D\:\\ProgramData\\anaconda3\\condabin;D\:\\ProgramData\\anaconda3\\Library\\bin;D\:\\ProgramData\\anaconda3\\Library\\mingw-w64\\bin;D\:\\Program Files\\Git\\cmd;D\:\\Program Files\\netcat-win32-1.12;D\:\\Program Files\\MATLAB\\R2023a\\runtime\\win64;D\:\\Program Files\\MATLAB\\R2023a\\bin;D\:\\Program Files\\MiKTeX\\miktex\\bin\\x64\\;C\:\\Program Files\\Pandoc\\;C\:\\ProgramData\\chocolatey\\bin;D\:\\Program Files\\Go\\bin;D\:\\Program Files\\nodejs\\;;C\:\\Program Files (x86)\\NVIDIA Corporation\\PhysX\\Common;C\:\\Program Files\\NVIDIA Corporation\\NVIDIA NvDLISR;D\:\\Program Files\\Calibre2\\;C\:\\Users\\Administrator\\AppData\\Local\\Microsoft\\WindowsApps;;D\:\\Program Files\\JetBrains\\PyCharm 2023.1.3\\bin;;D\:\\Program Files\\JetBrains\\IntelliJ IDEA 2023.1.3\\bin;;D\:\\Program Files\\JetBrains\\WebStorm 2023.1.3\\bin;;D\:\\Program Files\\Microsoft VS Code\\bin;D\:\\Program Files\\Fiddler;D\:\\Program Files\\JetBrains\\DataSpell 2023.2\\bin;;D\:\\Program Files\\JetBrains\\Aqua 232.8660.199\\bin;;D\:\\Program Files\\JetBrains\\GoLand 2023.2\\bin;;C\:\\Users\\Administrator\\go\\bin;C\:\\Users\\Administrator\\AppData\\Roaming\\npm;.
java.vm.info=mixed mode, emulated-client, sharing
java.vendor=Oracle Corporation
java.vm.version=17.0.8+9-LTS-211
java.rmi.server.randomIDs=true
sun.io.unicode.encoding=UnicodeLittle
java.class.version=61.0
(2) jinfo -flags <pid>
查看曾经赋过值的一些参数
C:\Users\Administrator>jinfo -flags 37464
VM Flags:
-XX:CICompilerCount=15 -XX:ConcGCThreads=6 -XX:G1ConcRefinementThreads=23 -XX:G1EagerReclaimRemSetThreshold=64 -XX:G1HeapRegionSize=8388608 -XX:GCDrainStackTargetSize=64 -XX:InitialHeapSize=1073741824 -XX:+ManagementServer -XX:MarkStackSize=4194304 -XX:MaxHeapSize=17137926144 -XX:MaxNewSize=10276044800 -XX:MinHeapDeltaBytes=8388608 -XX:MinHeapSize=8388608 -XX:NonProfiledCodeHeapSize=0 -XX:-ProfileInterpreter -XX:ProfiledCodeHeapSize=0 -XX:SoftMaxHeapSize=17137926144 -XX:TieredStopAtLevel=1 -XX:+UseCompressedClassPointers -XX:+UseCompressedOops -XX:+UseG1GC -XX:-UseLargePagesIndividualAllocation
(3) jinfo -flag <参数名称> <pid>
查看某个java进程的具体参数信息
C:\Users\Administrator>jinfo -flag UseG1GC 37464
-XX:+UseG1GC

C:\Users\Administrator>jinfo -flag MaxHeapSize 37464
-XX:MaxHeapSize=17137926144
2.4.1.2 修改
jifno 不仅可以查看运行时某一个Java虚拟机参数的实际取值,甚至可以在运行时修改部分参数,并使之立即生效。
但是,并非所有参数都支持动态修改。参数只有被标记为 manageable 的 flag 可以被实时修改。其实,这个修改能力是极其有限的。
PS C:\Users\Administrator> java -XX:+PrintFlagsFinal -version | findstr manageable
java version "11.0.19" 2023-04-18 LTS
Java(TM) SE Runtime Environment 18.9 (build 11.0.19+9-LTS-224)
Java HotSpot(TM) 64-Bit Server VM 18.9 (build 11.0.19+9-LTS-224, mixed mode)
     intx CMSAbortablePrecleanWaitMillis           = 100                                    {manageable} {default}
     intx CMSTriggerInterval                       = -1                                     {manageable} {default}
     intx CMSWaitDuration                          = 2000                                   {manageable} {default}
     bool HeapDumpAfterFullGC                      = false                                  {manageable} {default}
     bool HeapDumpBeforeFullGC                     = false                                  {manageable} {default}
     bool HeapDumpOnOutOfMemoryError               = false                                  {manageable} {default}
    ccstr HeapDumpPath                             =                                        {manageable} {default}
    uintx MaxHeapFreeRatio                         = 70                                     {manageable} {default}
    uintx MinHeapFreeRatio                         = 40                                     {manageable} {default}
     bool PrintClassHistogram                      = false                                  {manageable} {default}
     bool PrintConcurrentLocks                     = false                                  {manageable} {default}
Windows的管道命令中使用 findstr 查找字符串,而 Linux 或 MAC 则使用 grep 查找字符串。上面的命令在 Linux 或 MAC 系统中应为:
java -XX:+PrintFlagsFinal -version | grep manageable
(1) 针对boolean类型
jinfo -flag [+|-]<参数名称> <pid>
PS C:\Users\Administrator> jinfo -flag PrintClassHistogram 37464
-XX:-PrintClassHistogram # 这里是 - 号,说明值是 false

PS C:\Users\Administrator> jinfo -flag +PrintClassHistogram 37464 # 设置 PrintClassHistogram 为 true
PS C:\Users\Administrator> jinfo -flag PrintClassHistogram 37464 # 查看 PrintClassHistogram 参数
-XX:+PrintClassHistogram # 这里变成 + 号,说明值已变为 true

PS C:\Users\Administrator> jinfo -flag -PrintClassHistogram 37464 # 设置 PrintClassHistogram 为 false
PS C:\Users\Administrator> jinfo -flag PrintClassHistogram 37464 # 查看 PrintClassHistogram 参数
-XX:-PrintClassHistogram # 这里是 - 号,说明值是 false
(2) 针对非boolean类型
jinfo -flag <参数名称>=<参数值> <pid>
PS C:\Users\Administrator> jinfo -flag MaxHeapFreeRatio 37464
-XX:MaxHeapFreeRatio=70
PS C:\Users\Administrator> jinfo -flag MaxHeapFreeRatio=75 37464
PS C:\Users\Administrator> jinfo -flag MaxHeapFreeRatio 37464
-XX:MaxHeapFreeRatio=75
2.4.2 拓展
(1) java -XX:+PrintFlagsInitial
查看所有JVM参数启动的初始值
[Global flags]
     intx ActiveProcessorCount                      = -1                                  {product}
    uintx AdaptiveSizeDecrementScaleFactor          = 4                                   {product}
    uintx AdaptiveSizeMajorGCDecayTimeScale         = 10                                  {product}
    uintx AdaptiveSizePausePolicy                   = 0                                   {product}
...
(2) java -XX:+PrintFlagsFinal
查看所有JVM参数的最终值
PS C:\Users\Administrator> java -XX:+PrintFlagsFinal -version
[Global flags]
      int ActiveProcessorCount                     = -1                                        {product} {default}
    uintx AdaptiveSizeDecrementScaleFactor         = 4                                         {product} {default}
    uintx AdaptiveSizeMajorGCDecayTimeScale        = 10                                        {product} {default}
    uintx AdaptiveSizePolicyCollectionCostMargin   = 50                                        {product} {default}
    uintx AdaptiveSizePolicyInitializingSteps      = 20                                        {product} {default}
    uintx AdaptiveSizePolicyOutputInterval         = 0                                         {product} {default}
    uintx AdaptiveSizePolicyWeight                 = 10                                        {product} {default}
    uintx AdaptiveSizeThroughPutPolicy             = 0                                         {product} {default}
    uintx AdaptiveTimeWeight                       = 25                                        {product} {default}
    ...
(3) java -参数名称:+PrintCommandLineFlags
查看那些已经被用户或者JVM设置过的详细的XX参数的名称和值
PS C:\Users\Administrator> java  -XX:+PrintCommandLineFlags -version
-XX:G1ConcRefinementThreads=23 -XX:GCDrainStackTargetSize=64 -XX:InitialHeapSize=1070677888 -XX:MaxHeapSize=17130846208 -XX:+PrintCommandLineFlags -XX:ReservedCodeCacheSize=251658240 -XX:+SegmentedCodeCache -XX:+UseCompressedClassPointers -XX:+UseCompressedOops -XX:+UseG1GC -XX:-UseLargePagesIndividualAllocation
java version "11.0.19" 2023-04-18 LTS
Java(TM) SE Runtime Environment 18.9 (build 11.0.19+9-LTS-224)
Java HotSpot(TM) 64-Bit Server VM 18.9 (build 11.0.19+9-LTS-224, mixed mode)
2.5 jmap 导出内存映像文件&内存使用情况
jmap(JVM Memory Map):作用一方面是获取dump文件(堆转储快照文件,二进制文件),它还可以获取目标Java��进程的内存相关信息,包括Java堆各区域的使用情况、堆中对象的统计信息、类加载信息等。开发人员可以在控制台中输入命令“jmap -help”查阅jmap工具的具体使用方式和一些标准选项配置。
官方帮助文档:https://docs.oracle.com/en/java/javase/11/tools/jmap.html
C:\Users\Administrator>jmap -help
Usage:
    jmap -clstats <pid>
        to connect to running process and print class loader statistics
    jmap -finalizerinfo <pid>
        to connect to running process and print information on objects awaiting finalization
    jmap -histo[:live] <pid>
        to connect to running process and print histogram of java object heap
        if the "live" suboption is specified, only count live objects
    jmap -dump:<dump-options> <pid>
        to connect to running process and dump java heap
    jmap -? -h --help
        to print this help message

    dump-options:
      live         dump only live objects; if not specified,
                   all objects in the heap are dumped.
      format=b     binary format
      file=<file>  dump heap to <file>

    Example: jmap -dump:live,format=b,file=heap.bin <pid>
2.5.1 基本语法
jmap [option] <pid>jmap [option] <executable <core>jmap [option] [server_id@] <remote server IP or hostname>
参数说明:
| 选项 | 作用 |
|---|---|
| -dump | 生成dump文件(Java堆转储快照),-dump:live只保存堆中的存活对象 |
| -heap | 输出整个堆空间的详细信息,包括GC的使用、堆配置信息,以及内存的使用信息等 |
| -histo | 输出堆空间中对象的统计信息,包括类、实例数量和合计容量,-histo:live只统计堆中的存活对象 |
| -J <flag> | 传递参数给jmap启动的jvm |
| -finalizerinfo | 显示在F-Queue中等待Finalizer线程执行finalize方法的对象,仅linux/solaris平台有效 |
| -permstat | 以ClassLoader为统计口径输出永久代的内存状态信息,仅linux/solaris平台有效 |
| -F | 当虚拟机进程对-dump选项没有任何响应时,强制执行生成dump文件,仅linux/solaris平台有效 |
- 使用语法可以通过在DOS窗口中使用
jmap/jmap -h/jmap -help查看 <executable <core>代表可执行的代码,比如使用> 文件名称来指定生成的dump文件的生成位置[server_id@]<……>是为远程连接准备的
2.5.2 使用1:导出内存映像文件
(1) 手动方式
jmap -dump:format=b,file=<filename.hprof> <pid>
jmap -dump:live,format=b,file=<filename.hprof> <pid>
<filename.hprof>中的 filename 是文件名称,而 .hprof 是后缀名format=b表示生成的是标准的dump文件,用来进行格式限定
生成堆中所有对象的快照:
C:\Users\Administrator>jmap -dump:format=b,file=G:\dump\1.hprof 37464
Dumping heap to G:\dump\1.hprof ...
Heap dump file created [31893698 bytes in 0.079 secs]
生成堆中存活对象的快照:
C:\Users\Administrator>jmap -dump:live,format=b,file=G:\dump\2.hprof 37464
Dumping heap to G:\dump\2.hprof ...
Heap dump file created [26761056 bytes in 0.098 secs]
一般使用的是第二种方式,也就是生成堆中存活对象的快照,毕竟这种方式生成的dump文件更小,我们传输处理都更方便
(2) 自动方式
当程序发生 OOM 退出系统时,一些瞬时信息都随着程序的终止而消失,而重现 OOM 问题往往比较困难或者耗时。此时若能在 OOM 时,自动导出dump文件就显得非常迫切。
这里介绍一种比较常用的取得堆快照文件的方法,即使用:
-XX:+HeapDumpOn0utOfMemoryError:在程序发生 OOM 时,导出应用程序的当前堆快照。-XX:HeapDumpPath:可以指定堆快照的保存位置。
比如:
-Xmx100m -XX:+HeapDumpOnOutOfMemoryError -XX:HeapDumpPath=D:\m.hprof
2.5.3 使用2:显示堆内存相关信息
jmap -heap <pid>
只是时间点上的堆信息,而jstat后面可以添加参数,可以指定时间动态观察数据改变情况,而图形化界面工具,例如VisualVM等,它们可以用图表的方式动态展示出相关信息,更加直观明了
jmap -heap 3540 > a.txt
JDK 8 以后需要使用 jhsdb jmap
C:\Users\Administrator>jhsdb jmap --help
    <no option>             To print same info as Solaris pmap.
    --heap                  To print java heap summary.
    --binaryheap            To dump java heap in hprof binary format.
    --dumpfile <name>       The name of the dump file.
    --histo                 To print histogram of java object heap.
    --clstats               To print class loader statistics.
    --finalizerinfo         To print information on objects awaiting finalization.
    --pid <pid>             To attach to and operate on the given live process.
    --core <corefile>       To operate on the given core file.
    --exe <executable for corefile>
    --connect [<id>@]<host> To connect to a remote debug server (debugd).

    The --core and --exe options must be set together to give the core
    file, and associated executable, to operate on. They can use
    absolute or relative paths.
    The --pid option can be set to operate on a live process.
    The --connect option can be set to connect to a debug server (debugd).
    --core, --pid, and --connect are mutually exclusive.

    Examples: jhsdb jmap --pid 1234
          or  jhsdb jmap --core ./core.1234 --exe ./myexe
          or  jhsdb jmap --connect debugserver
          or  jhsdb jmap --connect id@debugserver
如上命令需要改为
jhsdb jmap --heap --pid 37464
请确保此工具的 JDK 版本和程序的 JDK 版本一致,否则会出现下面的错误
C:\Users\Administrator>jhsdb jmap --heap --pid 37464
Attaching to process ID 37464, please wait...
Exception in thread "main" java.lang.RuntimeException: Type "GenericGrowableArray", referenced in VMStructs::localHotSpotVMStructs in the remote VM, was not present in the remote VMStructs::localHotSpotVMTypes table (should have been caught in the debug build of that VM). Can not continue.
        at jdk.hotspot.agent/sun.jvm.hotspot.HotSpotTypeDataBase.lookupOrFail(HotSpotTypeDataBase.java:596)
        at jdk.hotspot.agent/sun.jvm.hotspot.HotSpotTypeDataBase.lookupType(HotSpotTypeDataBase.java:120)
        at jdk.hotspot.agent/sun.jvm.hotspot.HotSpotTypeDataBase.lookupOrCreateClass(HotSpotTypeDataBase.java:631)
        at jdk.hotspot.agent/sun.jvm.hotspot.HotSpotTypeDataBase.createType(HotSpotTypeDataBase.java:751)
        at jdk.hotspot.agent/sun.jvm.hotspot.HotSpotTypeDataBase.readVMTypes(HotSpotTypeDataBase.java:195)
        at jdk.hotspot.agent/sun.jvm.hotspot.HotSpotTypeDataBase.<init>(HotSpotTypeDataBase.java:89)
        at jdk.hotspot.agent/sun.jvm.hotspot.HotSpotAgent.setupVM(HotSpotAgent.java:393)
        at jdk.hotspot.agent/sun.jvm.hotspot.HotSpotAgent.go(HotSpotAgent.java:307)
        at jdk.hotspot.agent/sun.jvm.hotspot.HotSpotAgent.attach(HotSpotAgent.java:142)
        at jdk.hotspot.agent/sun.jvm.hotspot.tools.Tool.start(Tool.java:185)
        at jdk.hotspot.agent/sun.jvm.hotspot.tools.Tool.execute(Tool.java:118)
        at jdk.hotspot.agent/sun.jvm.hotspot.tools.JMap.main(JMap.java:176)
        at jdk.hotspot.agent/sun.jvm.hotspot.SALauncher.runJMAP(SALauncher.java:369)
        at jdk.hotspot.agent/sun.jvm.hotspot.SALauncher.main(SALauncher.java:538)
如果出现了上述错误,可以直接进入对应版本 JDK 的 bin 目录执行
D:\Java\jdk-17.0.8\bin>jhsdb jmap --heap --pid 37464
Attaching to process ID 37464, please wait...
Debugger attached successfully.
Server compiler detected.
JVM version is 17.0.8+9-LTS-211

using thread-local object allocation.
Garbage-First (G1) GC with 23 thread(s)

Heap Configuration:
   MinHeapFreeRatio         = 40
   MaxHeapFreeRatio         = 75
   MaxHeapSize              = 17137926144 (16344.0MB)
   NewSize                  = 1363144 (1.2999954223632812MB)
   MaxNewSize               = 10276044800 (9800.0MB)
   OldSize                  = 5452592 (5.1999969482421875MB)
   NewRatio                 = 2
   SurvivorRatio            = 8
   MetaspaceSize            = 22020096 (21.0MB)
   CompressedClassSpaceSize = 1073741824 (1024.0MB)
   MaxMetaspaceSize         = 17592186044415 MB
   G1HeapRegionSize         = 8388608 (8.0MB)

Heap Usage:
G1 Heap:
   regions  = 2043
   capacity = 17137926144 (16344.0MB)
   used     = 13493056 (12.86798095703125MB)
   free     = 17124433088 (16331.132019042969MB)
   0.07873213997204631% used
G1 Young Generation:
Eden Space:
   regions  = 0
   capacity = 33554432 (32.0MB)
   used     = 0 (0.0MB)
   free     = 33554432 (32.0MB)
   0.0% used
Survivor Space:
   regions  = 0
   capacity = 0 (0.0MB)
   used     = 0 (0.0MB)
   free     = 0 (0.0MB)
   0.0% used
G1 Old Generation:
   regions  = 2
   capacity = 33554432 (32.0MB)
   used     = 13493056 (12.86798095703125MB)
   free     = 20061376 (19.13201904296875MB)
   40.212440490722656% used
jmap -histo <pid>
输出堆中对象的同级信息,包括类、实例数量和合计容量,也是这一时刻的内存中的对象信息
jmap -histo 3540 > b.txt
与 -heap 一样,如果是 JDK 8 以上版本,则需要使用 jhsdb jmap 代替。
D:\Java\jdk-17.0.8\bin>jhsdb jmap --histo --pid 37464
Attaching to process ID 37464, please wait...
Debugger attached successfully.
Server compiler detected.
JVM version is 17.0.8+9-LTS-211
Iterating over heap. This may take a while...
Object Histogram:

num       #instances    #bytes  Class description
--------------------------------------------------------------------------
1:              47456   4326168 byte[]
2:              45062   1081488 java.lang.String
3:              7516    893384  java.lang.Class
4:              22728   727296  java.util.concurrent.ConcurrentHashMap$Node
5:              7450    655600  java.lang.reflect.Method
6:              8036    439304  java.lang.Object[]
...
2.5.4 使用3:其他作用
jmap -permstat <pid>:查看系统的ClassLoader信息jmap -finalizerinfo:查看堆积在finalizer队列中的对象
这两个指令仅 Linux/Solaris 平台有效
2.5.5 小结
由于jmap将访问堆中的所有对象,为了保�证在此过程中不被应用线程干扰,jmap需要借助安全点机制,让所有线程停留在不改变堆中数据的状态。也就是说,由jmap导出的堆快照必定是安全点位置的。这可能导致基于该堆快照的分析结果存在偏差。
举个例子,假设在编译生成的机器码中,某些对象的生命周期在两个安全点之间,那么:live选项将无法探知到这些对象。
另外,如果某个线程长时间无法跑到安全点,jmap将一直等下去。与前面讲的jstat则不同,垃圾回收器会主动将jstat所需要的摘要数据保存至固定位置之中,而jstat只需直接读取即可。
2.6 jhat JDK自带堆分析工具
jhat(JVM Heap Analysis Tool)
Sun JDK提供的jhat命令与jmap命令搭配使用,用于分析jmap生成的heap dump文件(堆转储快照)。jhat内置了一个微型的HTTP/HTML服务器,生成dump文件的分析结果后,用户可以在浏览器中查看分析结果(分析虚拟机转储快照信息)。
使用了jhat命令,就启动了一个http服务,端口是7000,即 http://localhost:7000/ ,就可以在浏览器里分析。
Warning
说明:jhat命令在JDK9、JDK10中已经被删除,官方建议用VisualVM代替。
D:\Java\jdk-1.8\bin>jhat -help
Usage:  jhat [-stack <bool>] [-refs <bool>] [-port <port>] [-baseline <file>] [-debug <int>] [-version] [-h|-help] <file>

        -J<flag>          Pass <flag> directly to the runtime system. For
                          example, -J-mx512m to use a maximum heap size of 512MB
        -stack false:     Turn off tracking object allocation call stack.
        -refs false:      Turn off tracking of references to objects
        -port <port>:     Set the port for the HTTP server.  Defaults to 7000
        -exclude <file>:  Specify a file that lists data members that should
                          be excluded from the reachableFrom query.
        -baseline <file>: Specify a baseline object dump.  Objects in
                          both heap dumps with the same ID and same class will
                          be marked as not being "new".
        -debug <int>:     Set debug level.
                            0:  No debug output
                            1:  Debug hprof file parsing
                            2:  Debug hprof file parsing, no server
        -version          Report version number
        -h|-help          Print this help and exit
        <file>            The file to read

For a dump file that contains multiple heap dumps,
you may specify which dump in the file
by appending "#<number>" to the file name, i.e. "foo.hprof#3".

All boolean options default to "true"
基本适用语法:jhat <option> <dumpfile>
| option参数 | 作用 |
|---|---|
| -stack false|true | 关闭|打开对象分配调用栈跟踪 |
| -refs false|true | 关闭|打开对象引用跟踪 |
| -port port-number | 设置jhat HTTP Server的端口号,默认7000 |
| -exclude exclude-file | 执行对象查询时需要排除的数据成员 |
| -baseline exclude-file | 指定一个基准堆转储 |
| -debug int | 设置debug级别 |
| -version | 启动后显示版本信息就退出 |
| -J <flag> | 传入启动参数,比如-J-Xmx512m |
举例如下:
jhat -stack false d:\1.hprof
jhat -port 6565 d:\1.hprof
jhat -version
2.7 jstack 打印JVM中线程快照
jstack(JVM Stack Trace):用于生成虚拟机指定进程当前时刻的线程快照(虚拟机堆栈跟踪)。线程快照就是当前虚拟机内指定进程的每一条线程正在执行的方法堆栈的集合。
生成线程快照的作用:可用于定位线程出现长时间停顿的原因,如线程间死锁、死循环、请求外部资源导致的长时间等待等问题。这些都是导致线程长时间停顿的常见原因。当线程出现停顿时,就可以用jstack显示各个线程调用的堆栈情况。
官方帮助文档:https://docs.oracle.com/en/java/javase/11/tools/jstack.html
在thread dump中,要留�意下面几种状态
- 死锁,Deadlock(重点关注)
- 等待资源,Waiting on condition(重点关注)
- 等待获取监视器,Waiting on monitor entry(重点关注)
- 阻塞,Blocked(重点关注)
- 执行中,Runnable
- 暂停,Suspended
- 对象等待中,Object.wait() 或 TIMED_WAITING
- 停止,Parked
option参数 作用
-F 当正常输出的请求不被响应时,强制输出线程堆栈
-l 除堆栈外,显示关于锁的附加信息
-m 如果调用本地方法的话,可以显示C/C++的堆栈
2.7.1 基本语法
C:\Users\Administrator>jstack -help
Usage:
    jstack [-l][-e] <pid>
        (to connect to running process)

Options:
    -l  long listing. Prints additional information about locks
    -e  extended listing. Prints additional information about threads
    -? -h --help -help to print this help message
它的基本用法为:jstack <options> <pid>,如下:
jstack 13500 > 1.txt
jstack -l 13500 > 1.txt
jstack 管理远程进程的话,需要在远程程序的启动参数中增加:
-Djava.rmi.server.hostname=<...>
-Dcom.sun.management.jmxremote
-Dcom.sun.management.jmxremote.port=9999
-Dcom.sun.management.jmxremote.authenticate=false
-Dcom.sun.management.jmxremote.ssl=false
2.7.2 Options
-F:当正常输出的请求不被响应时,强制输出线程堆栈-l:除堆栈外,显示关于锁的附加信息-m:如果调用本地方法的话,可以显示C/C++的堆栈-h:帮助操作
2.8 jcmd 多功能命令行
在JDK 1.7以后,新增了一个命令行工具jcmd。它是一个多功能的工具,可以用来实现前面除了jstat之外所有命令的功能。比如:用它来导出堆、内存使用、查看Java进程、导出线程信息、执行GC、JVM运行时间等。
官方帮助文档:https://docs.oracle.com/en/java/javase/11/tools/jcmd.html
jcmd拥有jmap的大部分功能,并且在Oracle的官方网站上也推荐使用jcmd命令代jmap命令
2.8.1 基本语法
C:\Users\Administrator>jcmd -help
Usage: jcmd <pid | main class> <command ...|PerfCounter.print|-f file>
   or: jcmd -l
   or: jcmd -h

  command must be a valid jcmd command for the selected jvm.
  Use the command "help" to see which commands are available.
  If the pid is 0, commands will be sent to all Java processes.
  The main class argument will be used to match (either partially
  or fully) the class used to start Java.
  If no options are given, lists Java processes (same as -l).

  PerfCounter.print display the counters exposed by this process
  -f  read and execute commands from the file
  -l  list JVM processes on the local machine
  -? -h --help print this help message
jcmd -l 列出所有的JVM进程
C:\Users\Administrator>jcmd -l
37492 org.jetbrains.jps.cmdline.Launcher D:/Program Files/JetBrains/IntelliJ IDEA 2023.1.3/plugins/java/lib/jps-builders.jar;D:/Program Files/JetBrains/IntelliJ IDEA 2023.1.3/plugins/java/lib/jps-builders-6.jar;D:/Program Files/JetBrains/IntelliJ IDEA 2023.1.3/plugins/java/lib/jps-javac-extension.jar;D:/Program Files/JetBrains/IntelliJ IDEA 2023.1.3/lib/util-8.jar;D:/Program Files/JetBrains/IntelliJ IDEA 2023.1.3/lib/util_rt.jar;D:/Program Files/JetBrains/IntelliJ IDEA 2023.1.3/lib/platform-loader.jar;D:/Program Files/JetBrains/IntelliJ IDEA 2023.1.3/lib/annotations.jar;D:/Program Files/JetBrains/IntelliJ IDEA 2023.1.3/lib/trove.jar;D:/Program Files/JetBrains/IntelliJ IDEA 2023.1.3/plugins/java/lib/jetbrains.kotlinx.metadata.jvm.jar;D:/Program Files/JetBrains/IntelliJ IDEA 2023.1.3/lib/protobuf.jar;D:/Program Files/JetBrains/IntelliJ IDEA 2023.1.3/lib/jps-model.jar;D:/Program Files/JetBrains/IntelliJ IDEA 2023.1.3/plugins/java/lib/javac2.jar;D:/Program Files/JetBrains/IntelliJ IDEA 2023.1.3/lib/forms_rt.jar;D:/Prog
37464 org.depsea.springwebmvcdemo.SpringWebmvcDemoApplication
49420 jdk.jcmd/sun.tools.jcmd.JCmd -l
jcmd <pid> help 针对指定的进程,列出支持的所有具体命令
C:\Users\Administrator>jcmd 37464 help
37464:
The following commands are available:
Compiler.CodeHeap_Analytics
Compiler.codecache
Compiler.codelist
Compiler.directives_add
Compiler.directives_clear
Compiler.directives_print
Compiler.directives_remove
Compiler.queue
...
VM.set_flag
VM.stringtable
VM.symboltable
VM.system_properties
VM.systemdictionary
VM.uptime
VM.version
help

For more information about a specific command use 'help <command>'.
jcmd 37464 help <command> 查看命令的详细信息
C:\Users\Administrator>jcmd 37464 help VM.version
37464:
VM.version
Print JVM version information.

Impact: Low

Permission: java.util.PropertyPermission(java.vm.version, read)

Syntax: VM.version
jcmd <pid> <command> ��显示指定进程的指令命令的数据
C:\Users\Administrator>jcmd 37464 VM.version
37464:
Java HotSpot(TM) 64-Bit Server VM version 17.0.8+9-LTS-211
JDK 17.0.8

C:\Users\Administrator>jcmd 37464 VM.uptime
37464:
173610.496 s
Thread.print可以替换jstack指令GC.class_histogram可以替换jmap中的-histo操作GC.heap_dump可以替换jmap中的-dump操作GC.run可以查看GC的执行情况VM.uptime可以查看程序的总执行时间,可以替换jstat指令中的-t操作VM.system_properties可以替换jinfo -sysprops 进程idVM.flags可以获取JVM的配置参数信息
2.9 jstatd 远程主机信息收集
之前的指令只涉及到监控本机的Java应用程序,而在这些工具中,一些监控工具也支持对远程计算机的监控(如jps、jstat)。为了启用远程监控,则需要配合使用jstatd 工具。
命令jstatd是一个RMI服务端程序,它的作用相当于代理服务器,建立本地计算机与远程监控工具的通信。jstatd服务器将本机的Java应用程序信息传递到远程计算机。
C:\Users\Administrator>jstatd -help
usage: jstatd [-nr] [-p port] [-n rminame]
       jstatd -?|-h|--help
